

Investing basics
How to read Wenlo’s technical chart
Candles, moving averages, Bollinger Bands, volume, MACD, RSI and VWAP on the ticker page’s Technical chart: what each line means, what it can’t tell you, and how it matches the screener.
Wenlo EditorialHow we write our guides8 min read
On this page
Switch the chart to Technical
Every ticker page, such as Apple’s, has a price chart with a Simple | Technical switch at its top right. Simple shows the price and volume. Technical adds candles, indicator lines over the price and indicator panes below it. Your choice is remembered on this device.
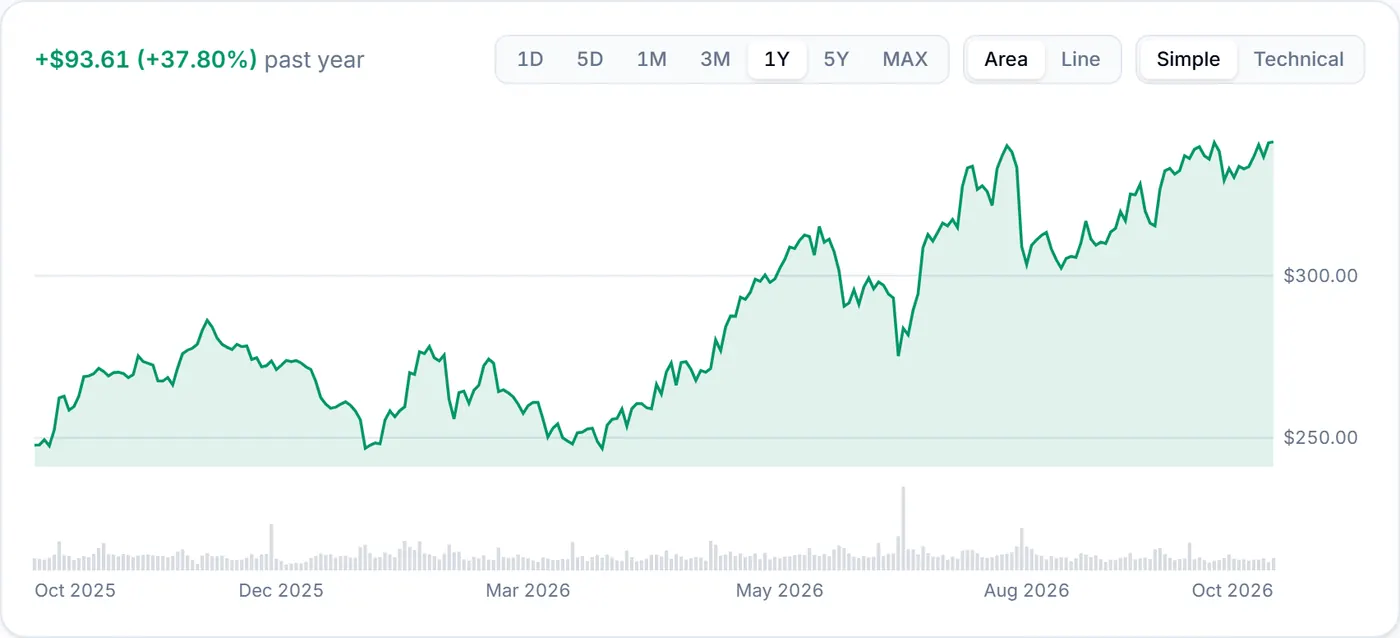
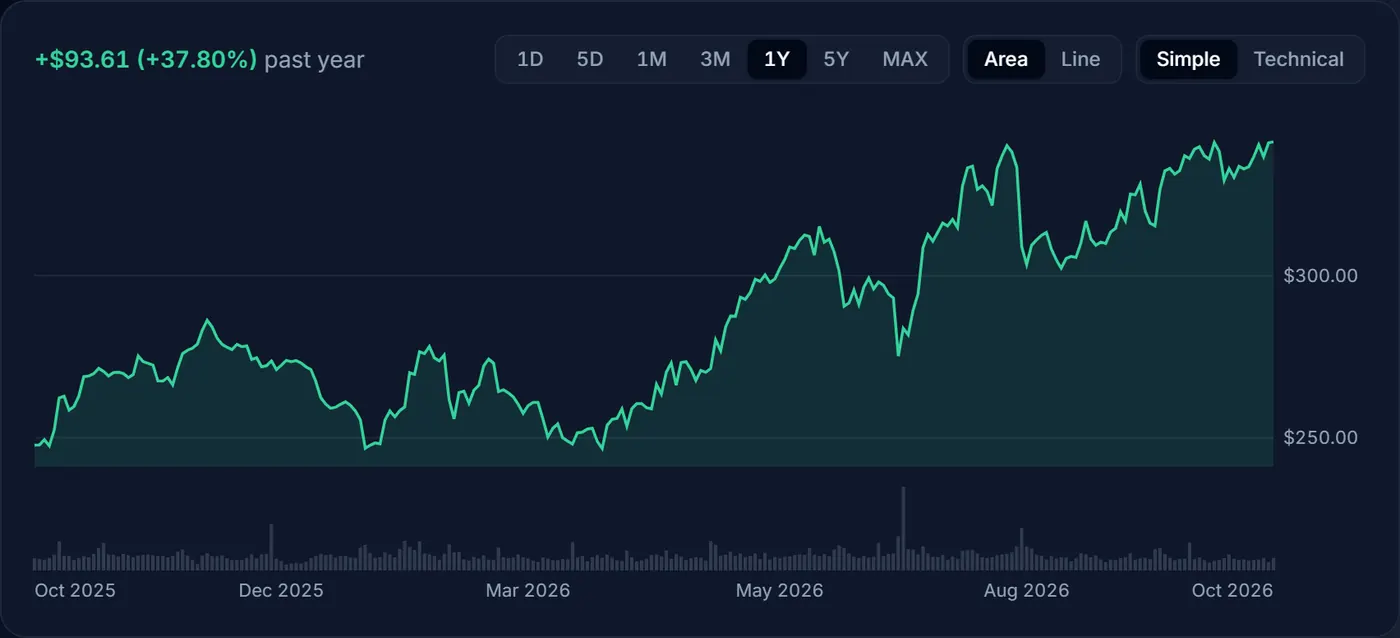
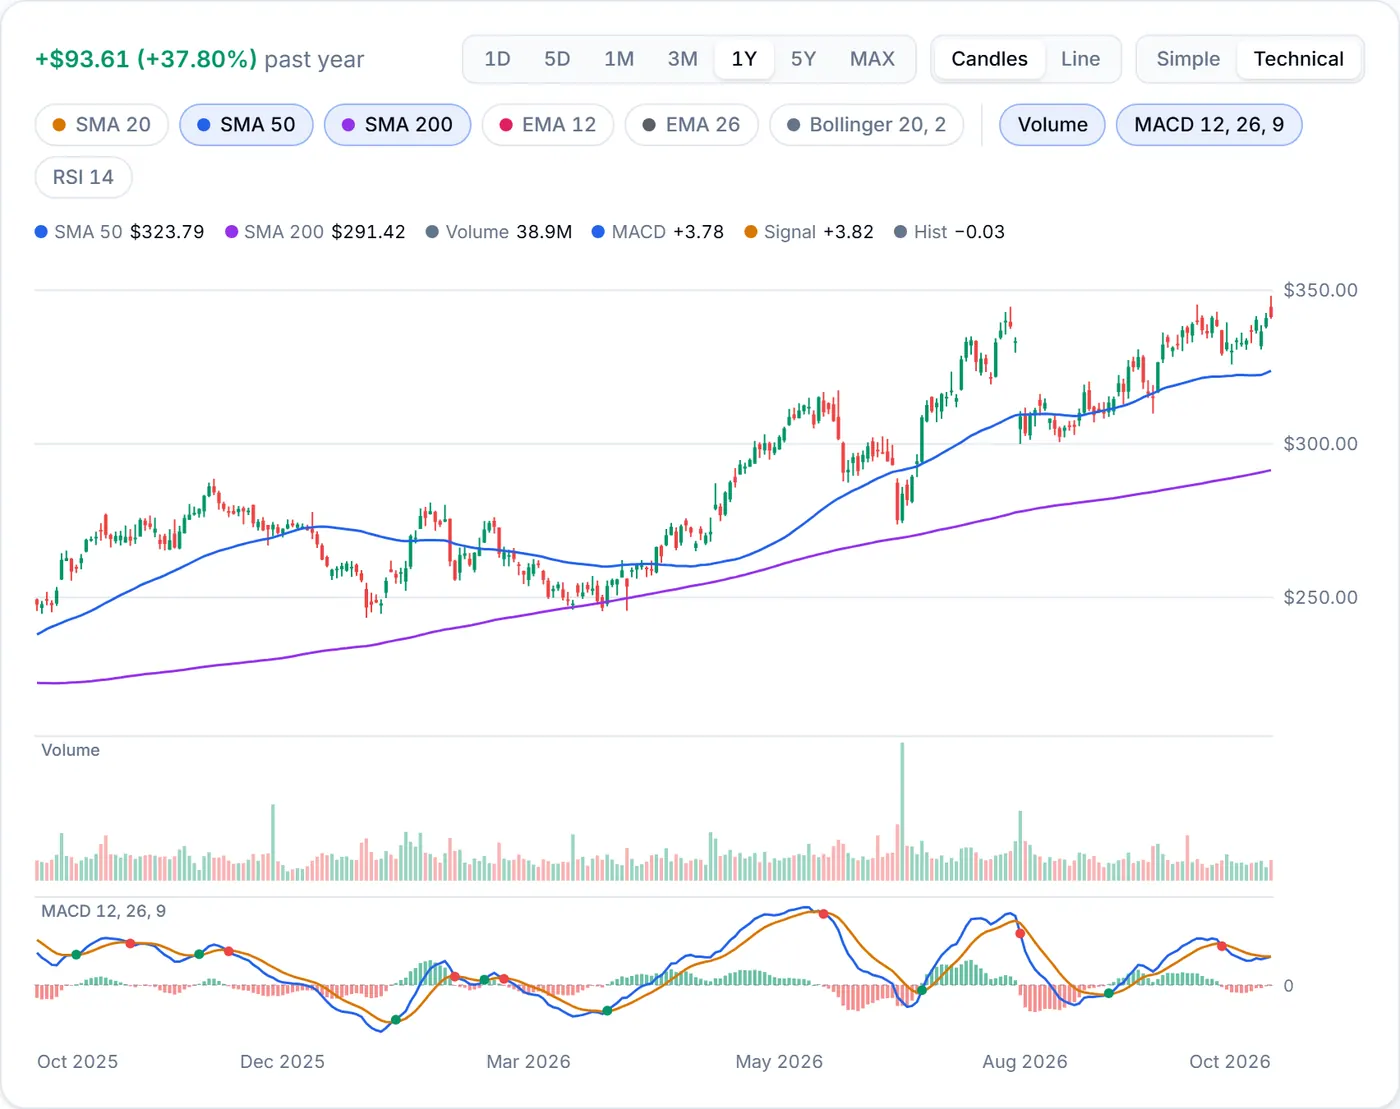
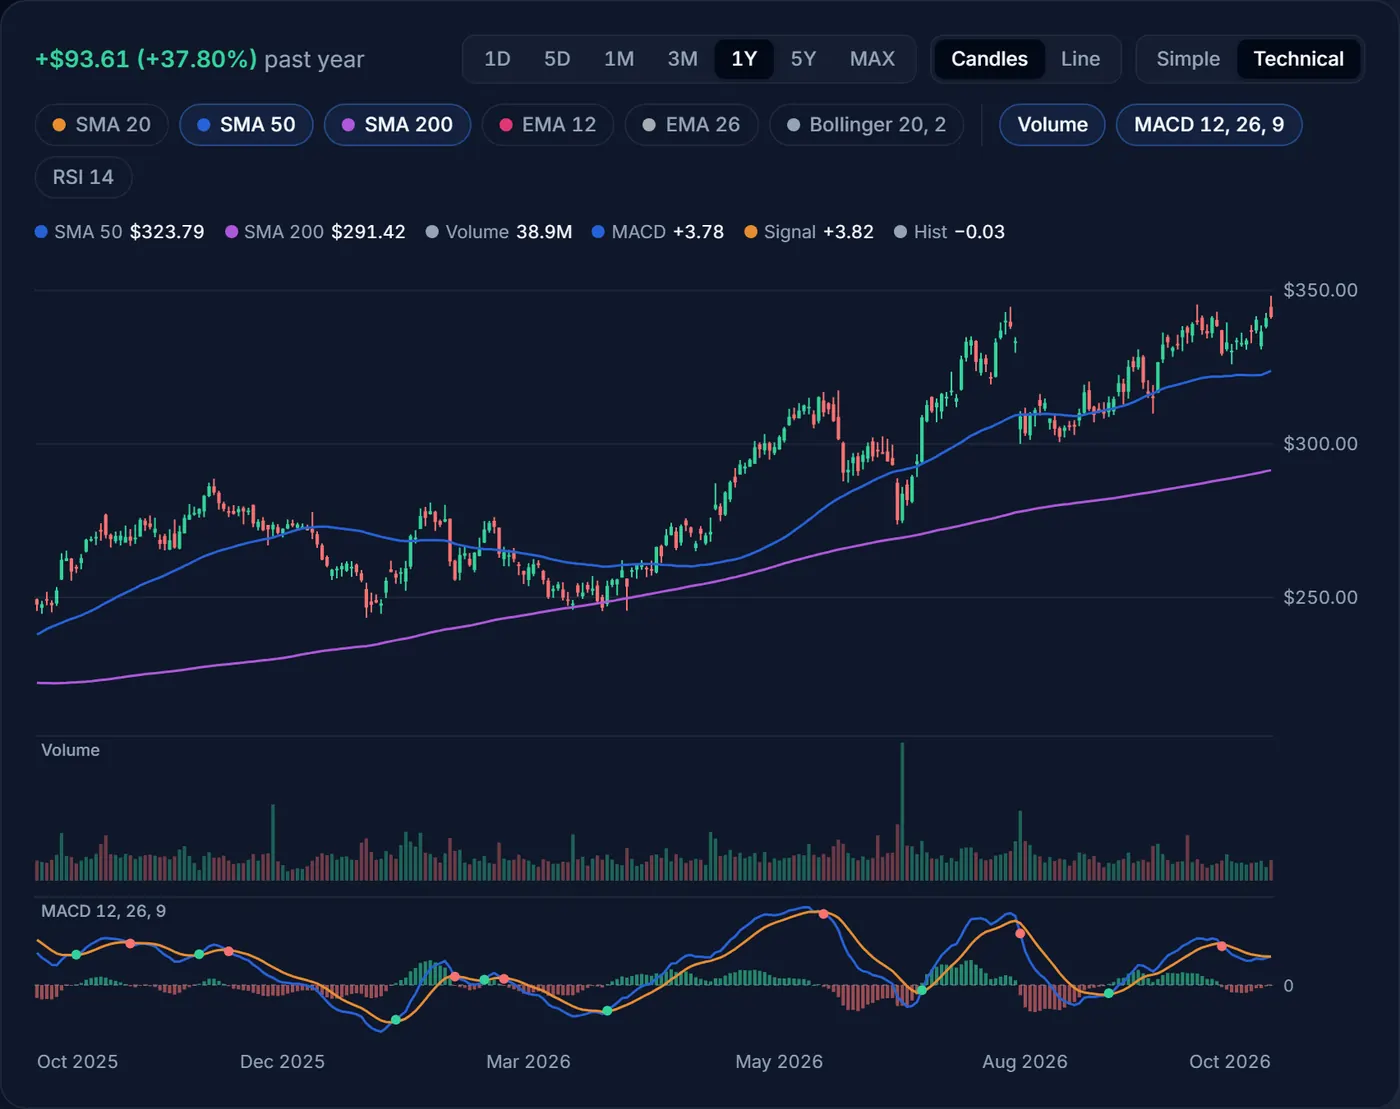
In Technical, a row of chips sits under the buttons. The first group draws on the price itself (SMA 20, SMA 50, SMA 200, EMA 12, EMA 26, Bollinger 20, 2, and VWAP on 1D and 5D). The second adds panes below it (Volume, MACD 12, 26, 9 and RSI 14). Press a chip to turn it on or off. The first time you switch, the chart shows the 50- and 200-day averages, volume and MACD.
Candles and lines
Each candle is one bar of time: a day on 1M to 5Y, five minutes on 1D and 5D. It shows four prices at once:
- The body runs from the open to the close. It is green when the close is at or above the open and red when it is below.
- The wicks, the thin lines above and below the body, reach the highest and lowest prices traded in that bar.
- A long wick means the price went far one way and came back before the bar ended.
Choose Line next to Candles to draw just the closing prices; the indicators stay the same.
Moving averages: SMA and EMA
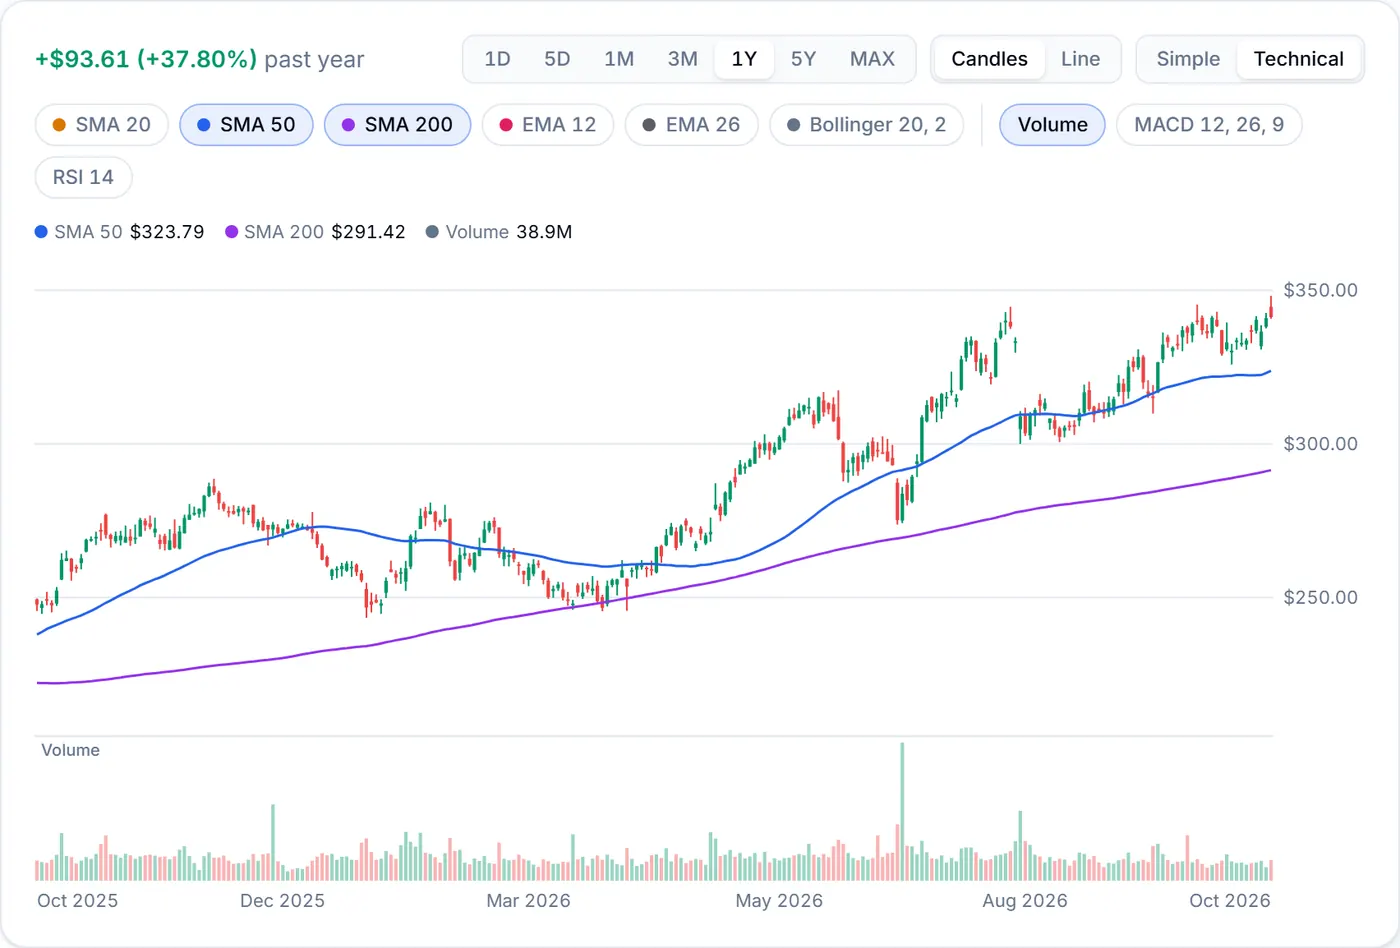
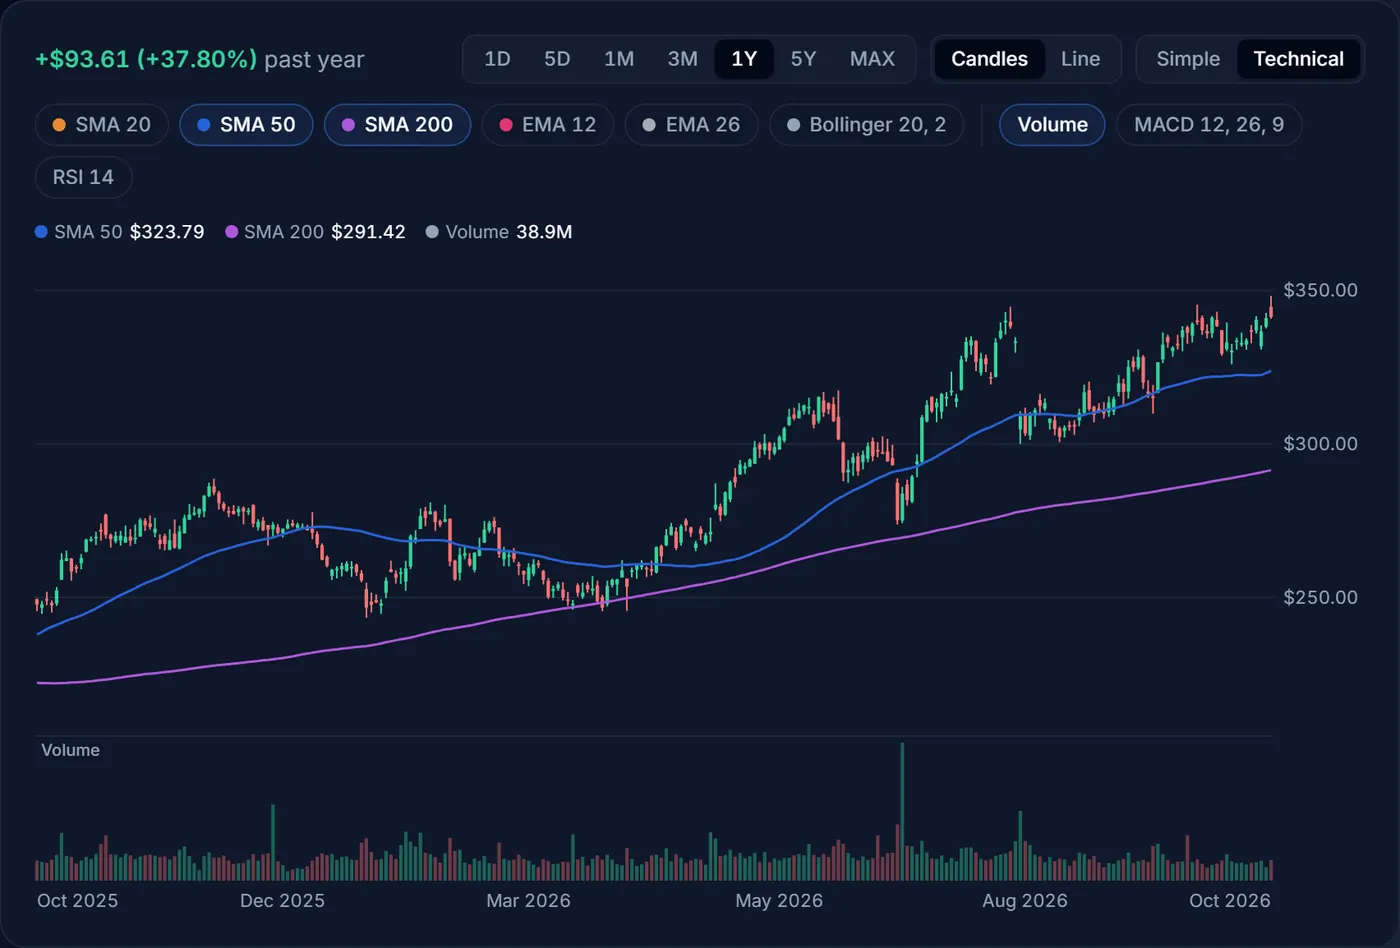
A simple moving average (SMA) is the average close of the last N bars, so SMA 50 on a daily chart is the average of the last 50 trading days (about ten weeks) and SMA 200 the last 200 (about ten months). An exponential moving average (EMA) gives recent bars more weight, so EMA 12 and EMA 26 turn sooner than an SMA of the same length. Both smooth out daily noise.
Many investors read them as simple trend lines: a price above its 200-day average is in a long-term uptrend, below it in a downtrend. When the 50-day rises above the 200-day, it is called a golden cross; when it falls below, a death cross. Both get a lot of attention, but both averages are slow, so the cross usually comes weeks after the price turned.
Bollinger Bands
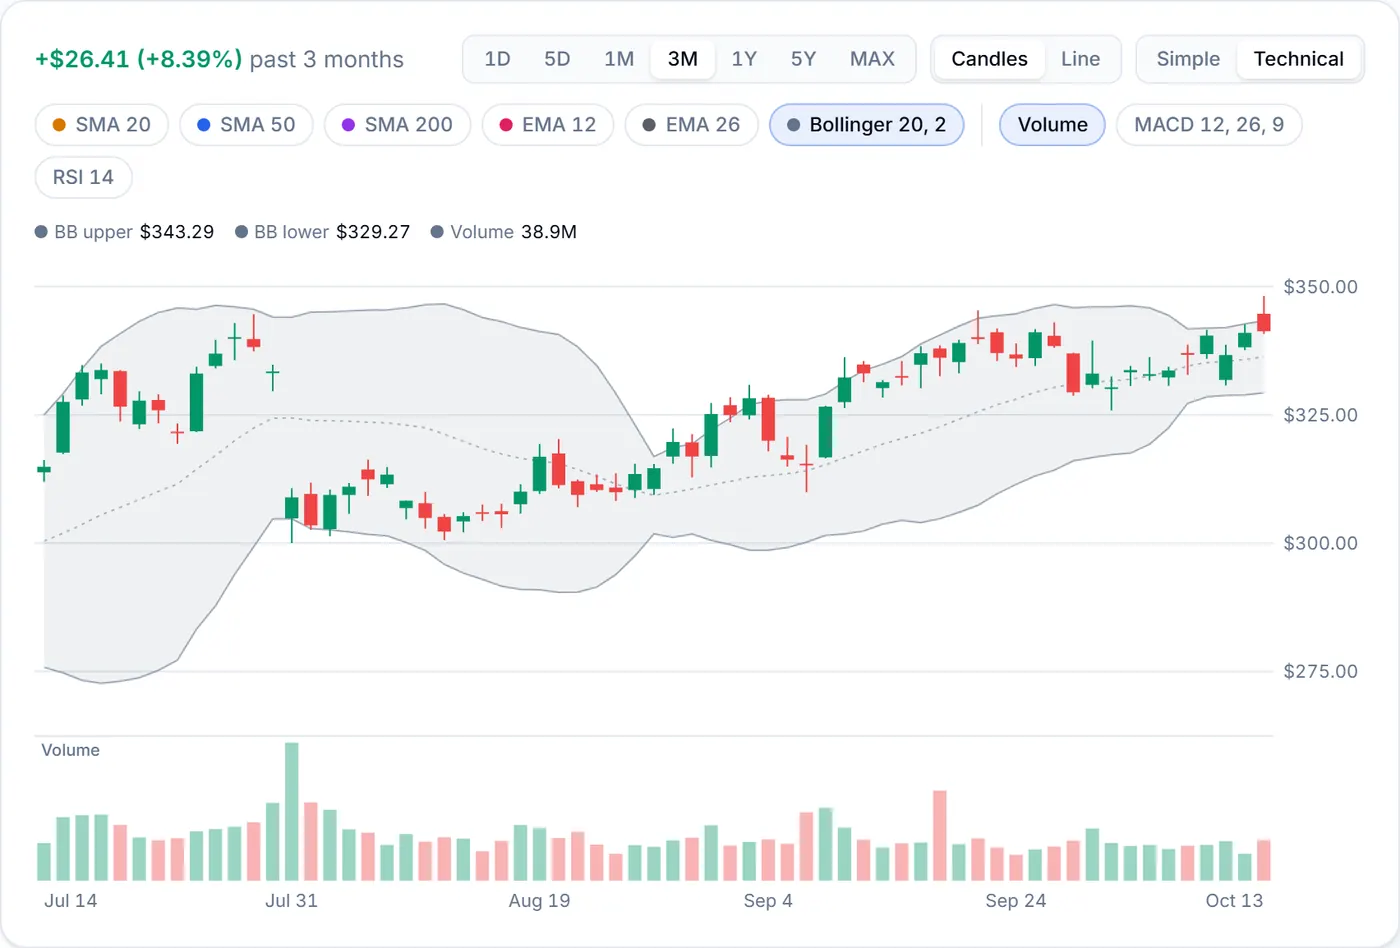
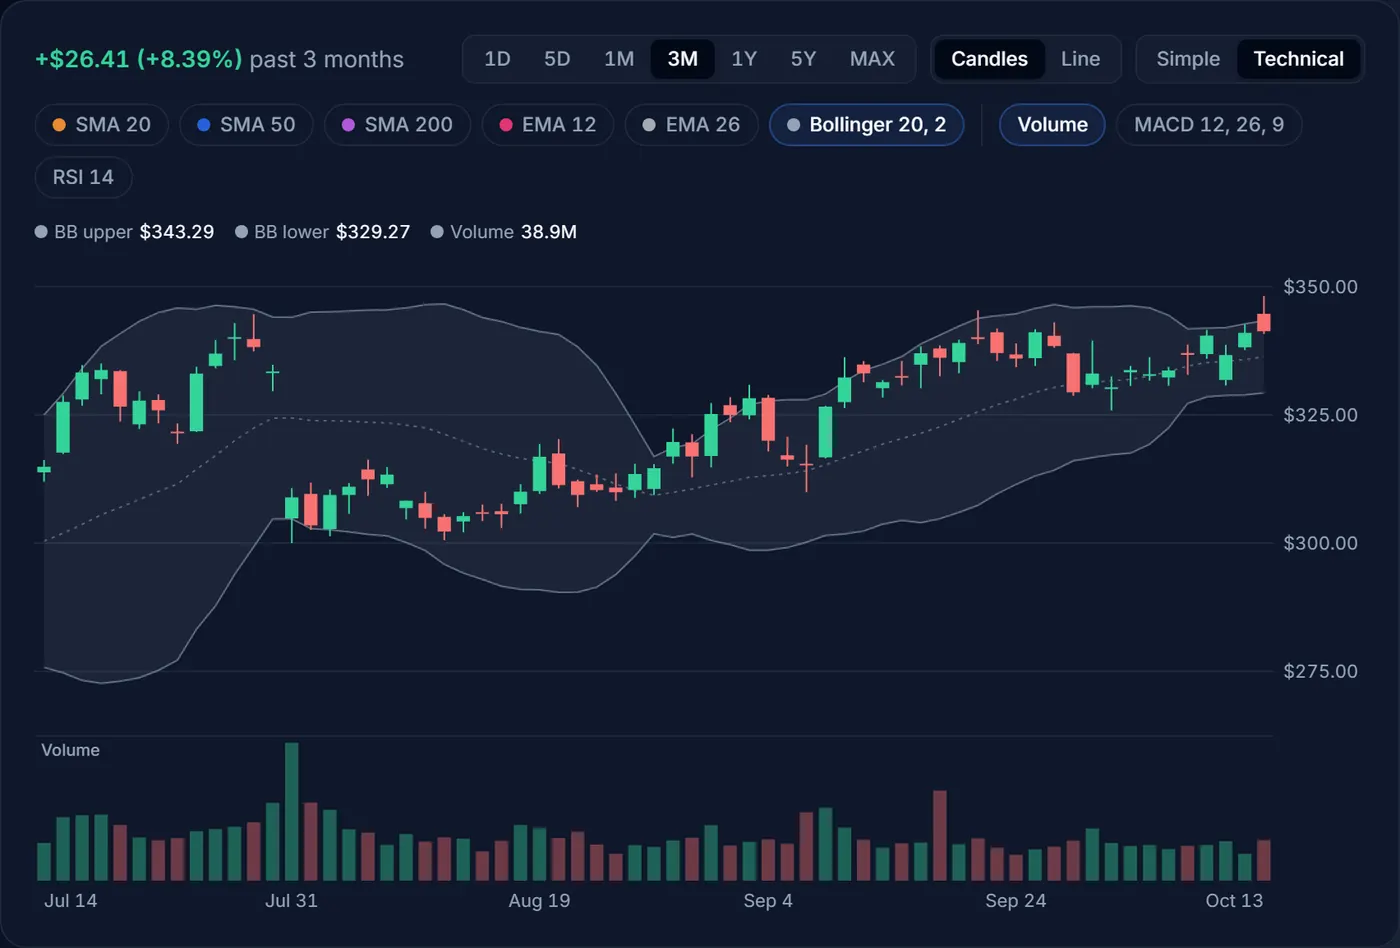
Bollinger Bands are three lines: the 20-day average in the middle (dotted) and two bands two standard deviations above and below it. Standard deviation measures how much the price has been swinging, so the bands widen when a stock gets jumpy and narrow when it goes quiet. A close outside them is an unusually big move for that stock.
When the bands pinch unusually close together, traders call it a squeeze. Quiet spells often come before bigger moves, but a squeeze says nothing about which way the next move will go.
Volume
The Volume pane shows how many shares traded in each bar, coloured like its candle. Volume is a rough measure of conviction: a big move on heavy volume usually reflects news a lot of people are acting on, while the same move on a quiet day carries less weight.
MACD
MACD (Moving Average Convergence Divergence, set to 12, 26, 9) is a momentum indicator built from two EMAs. The pane has four parts:
- The MACD line (blue) is the 12-day EMA minus the 26-day EMA. Above zero, the shorter-term trend is stronger than the longer one.
- The signal line (orange) is a 9-day EMA of the MACD line, a slower copy of it.
- The histogram is the gap between the two lines: green bars when MACD is above the signal line, red when below. Bars that grow mean momentum is building; bars that shrink mean it is fading.
- The dots mark each day the MACD line crossed the signal line: green when it crossed above, red when it crossed below. The dashed line is zero.
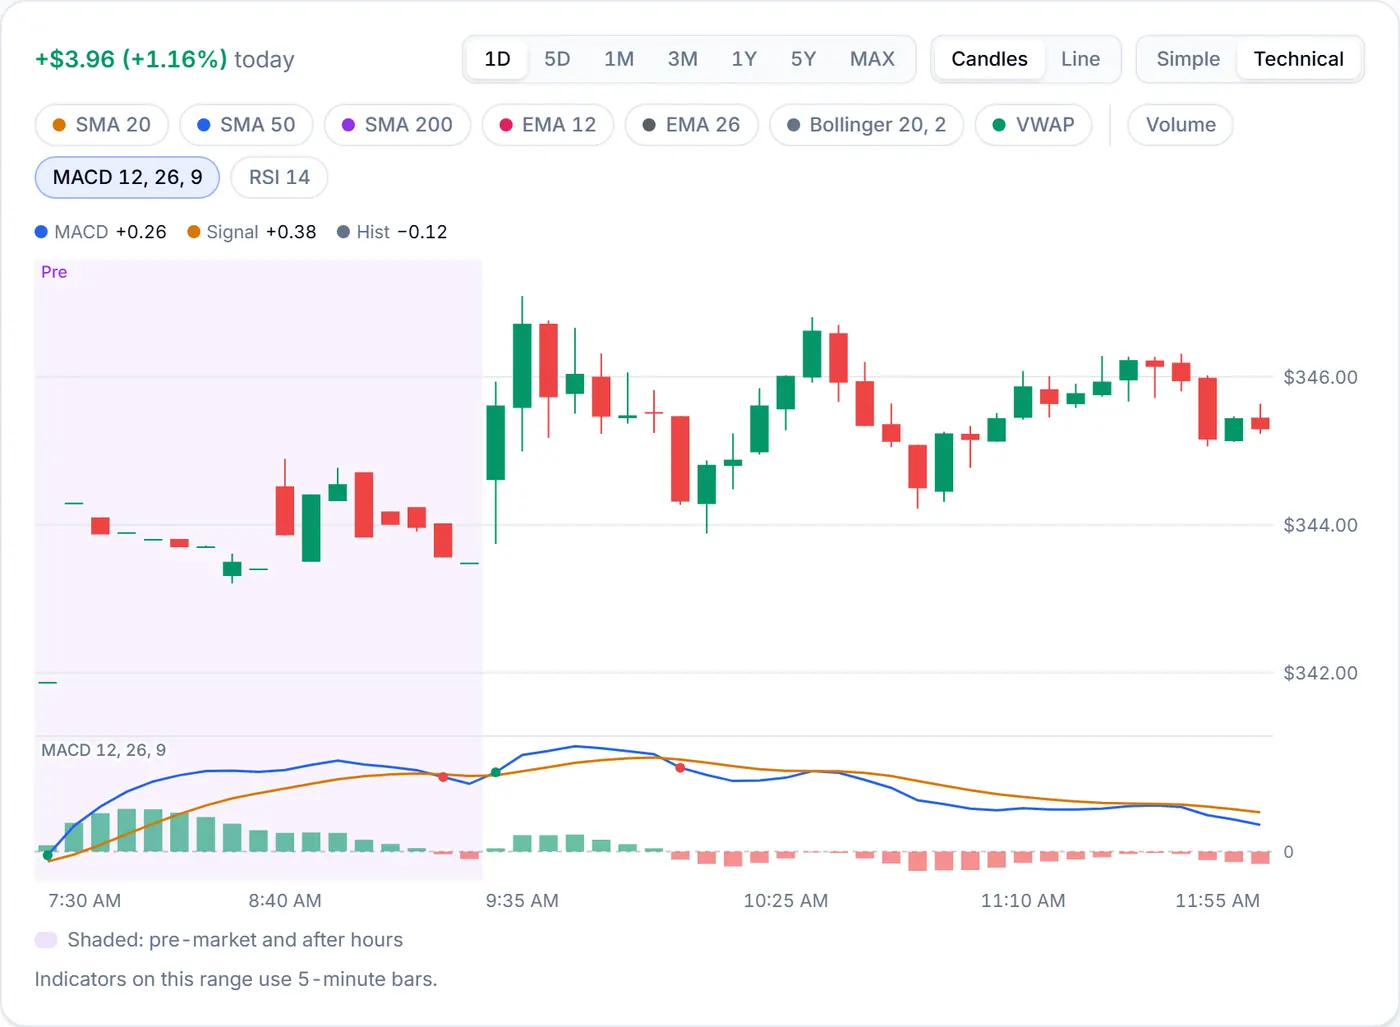
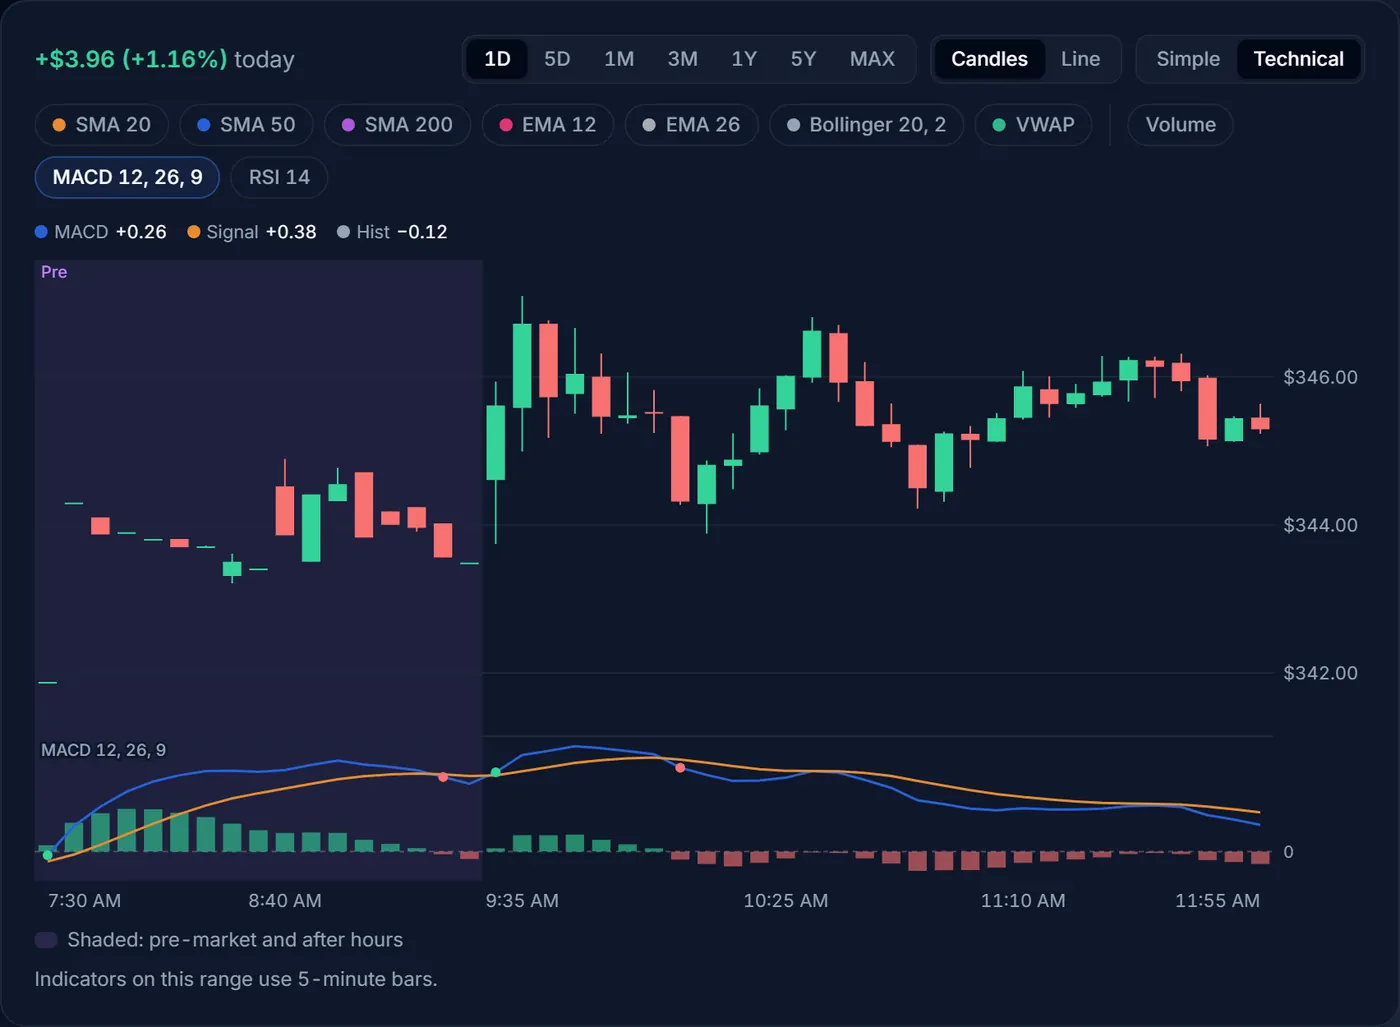
A crossover is an early, noisy sign that momentum is changing. A cross above the signal line below zero is a bounce inside a weaker trend; above zero, it happens inside a stronger one. Crosses come often, so many traders check them against the longer trend first.
RSI
The Relative Strength Index (RSI 14) compares the size of the up days with the down days over the last 14 bars, on a scale from 0 to 100. The dashed guides mark 70 and 30. Above 70 is often called overbought and below 30 oversold: the price has moved a long way, fast.
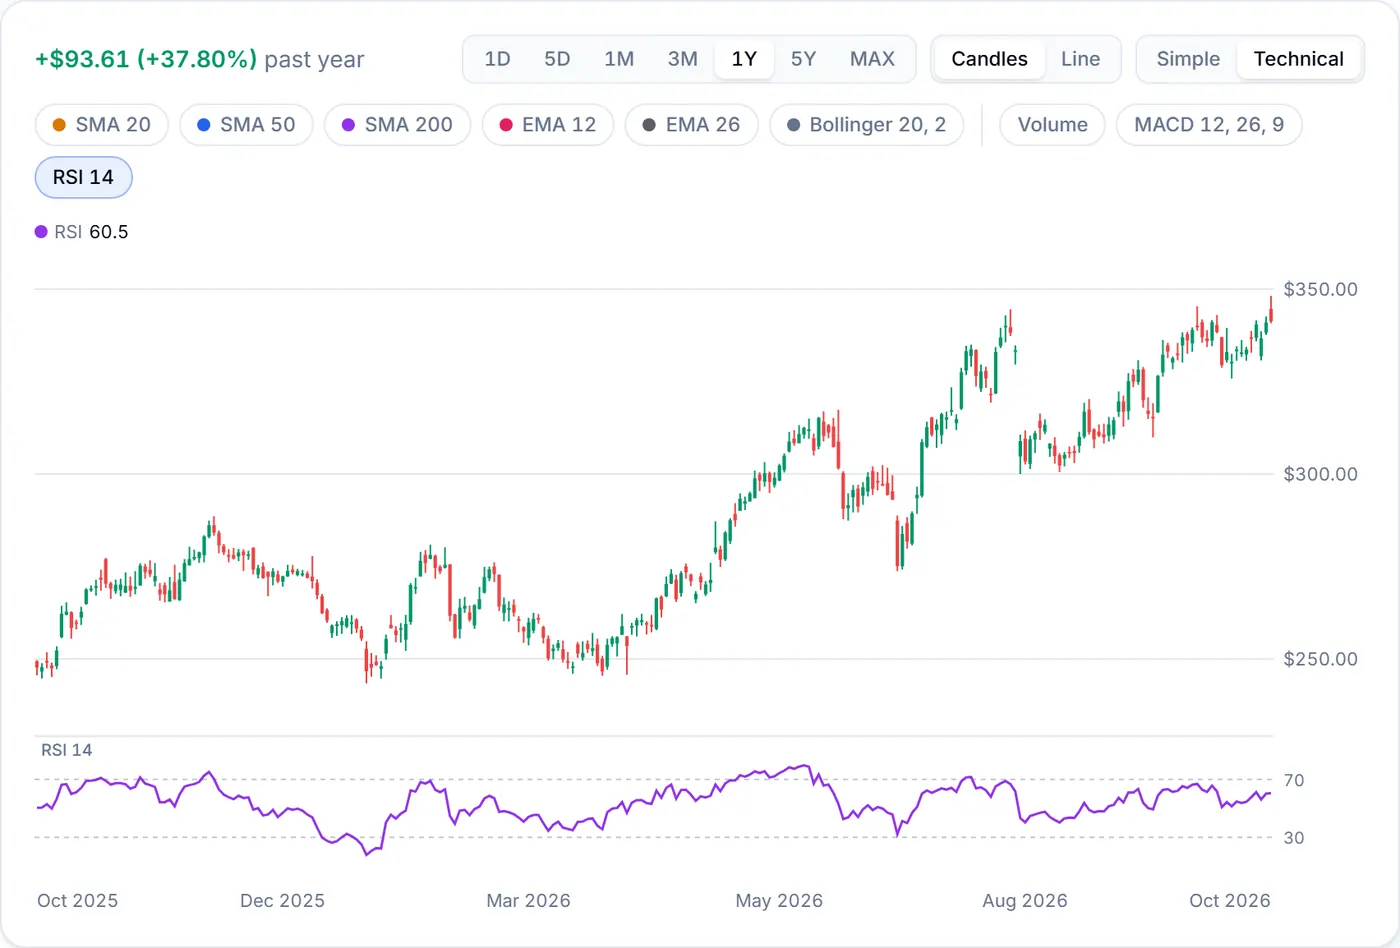
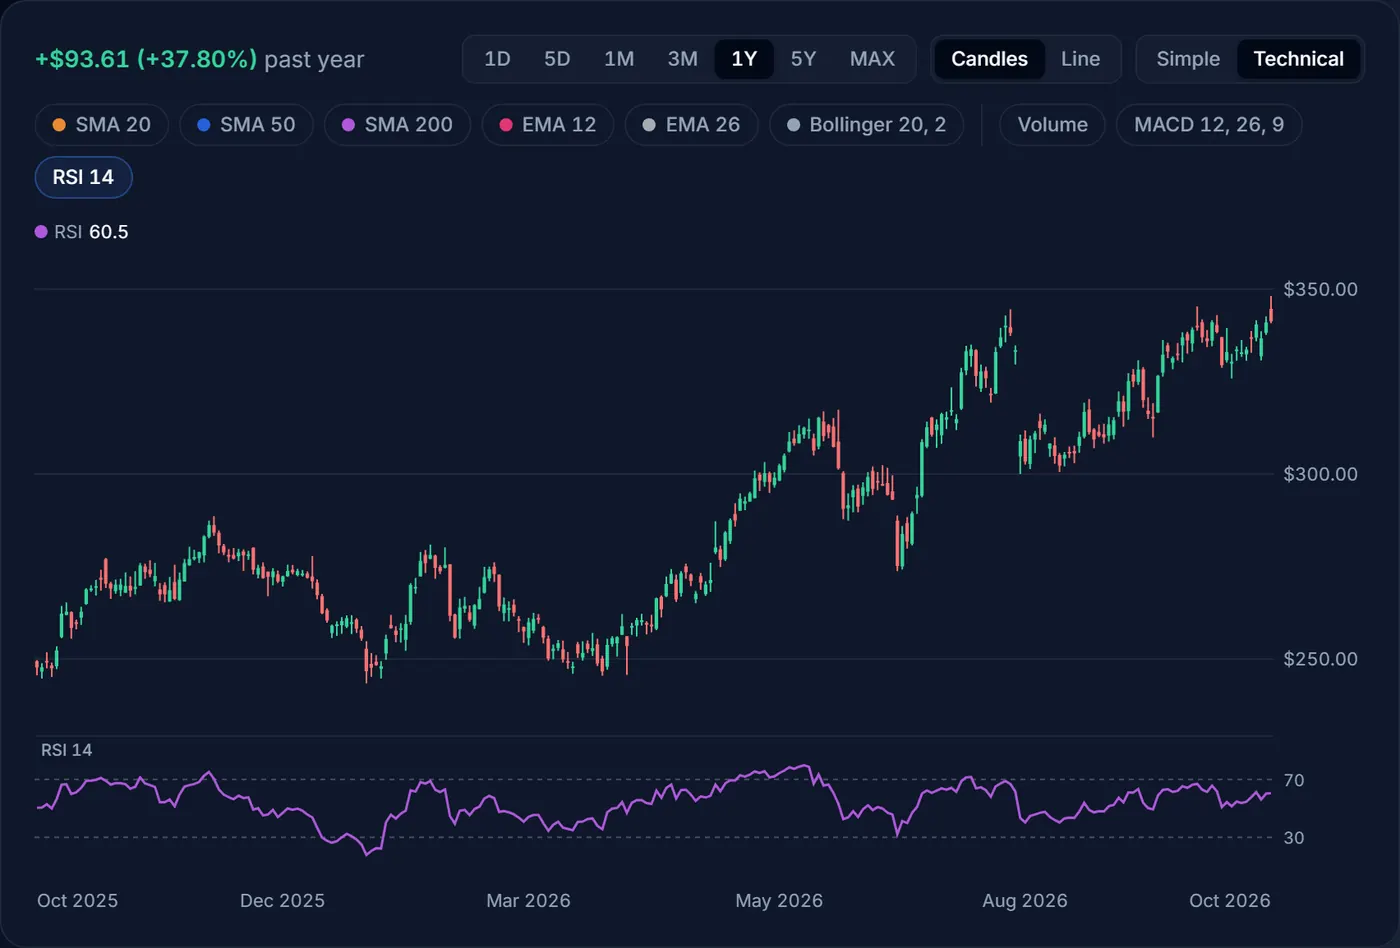
Those words sound like instructions, but they aren’t. In a strong uptrend RSI can stay above 70 for weeks while the price keeps rising, and in a slump it can stay below 30 while the price keeps falling. RSI tells you a move has been fast; it doesn’t tell you the move is over. Treat 70 and 30 as a reason to look closer, not as sell and buy signals on their own.
Read any bar with the crosshair
Move the pointer over the chart (on a phone, touch and drag) and a crosshair follows it. The box shows that bar’s date, open, high, low and close, and on wider screens every indicator you have on. The legend row above the chart shows the same readings, or the latest bar’s when you aren’t pointing at anything. With a keyboard, select the chart and use the arrow keys to step bar by bar.
Example
Reading one bar
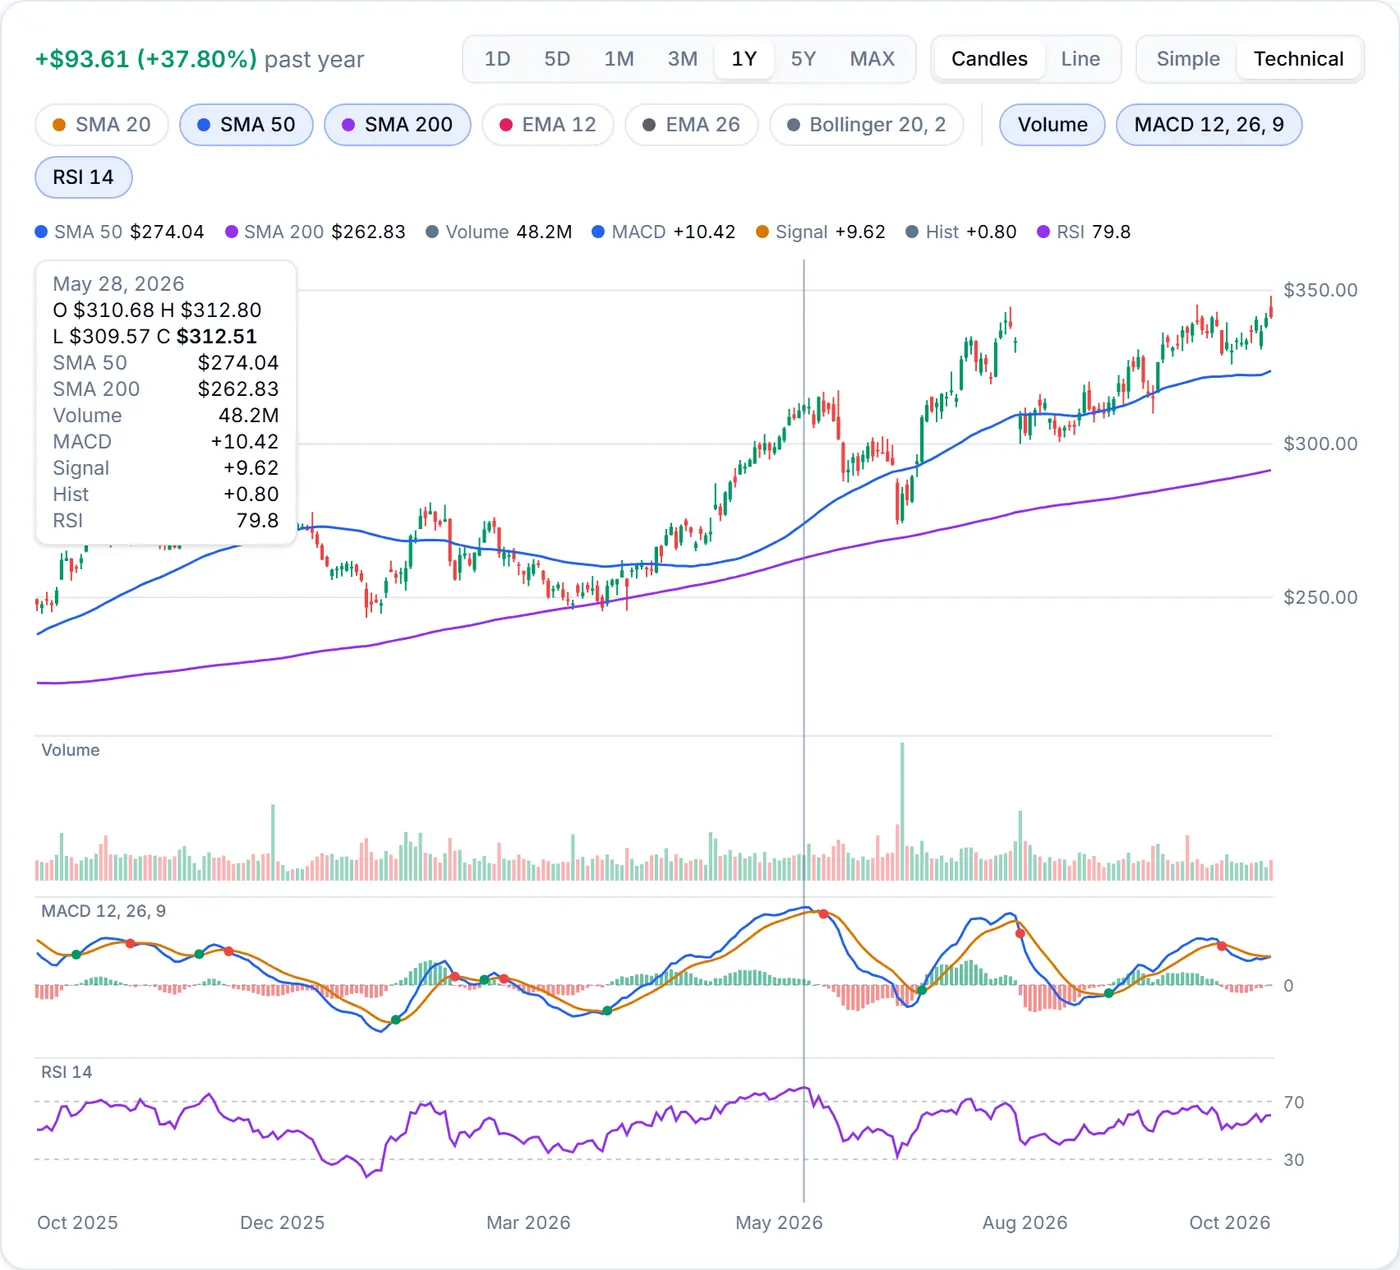
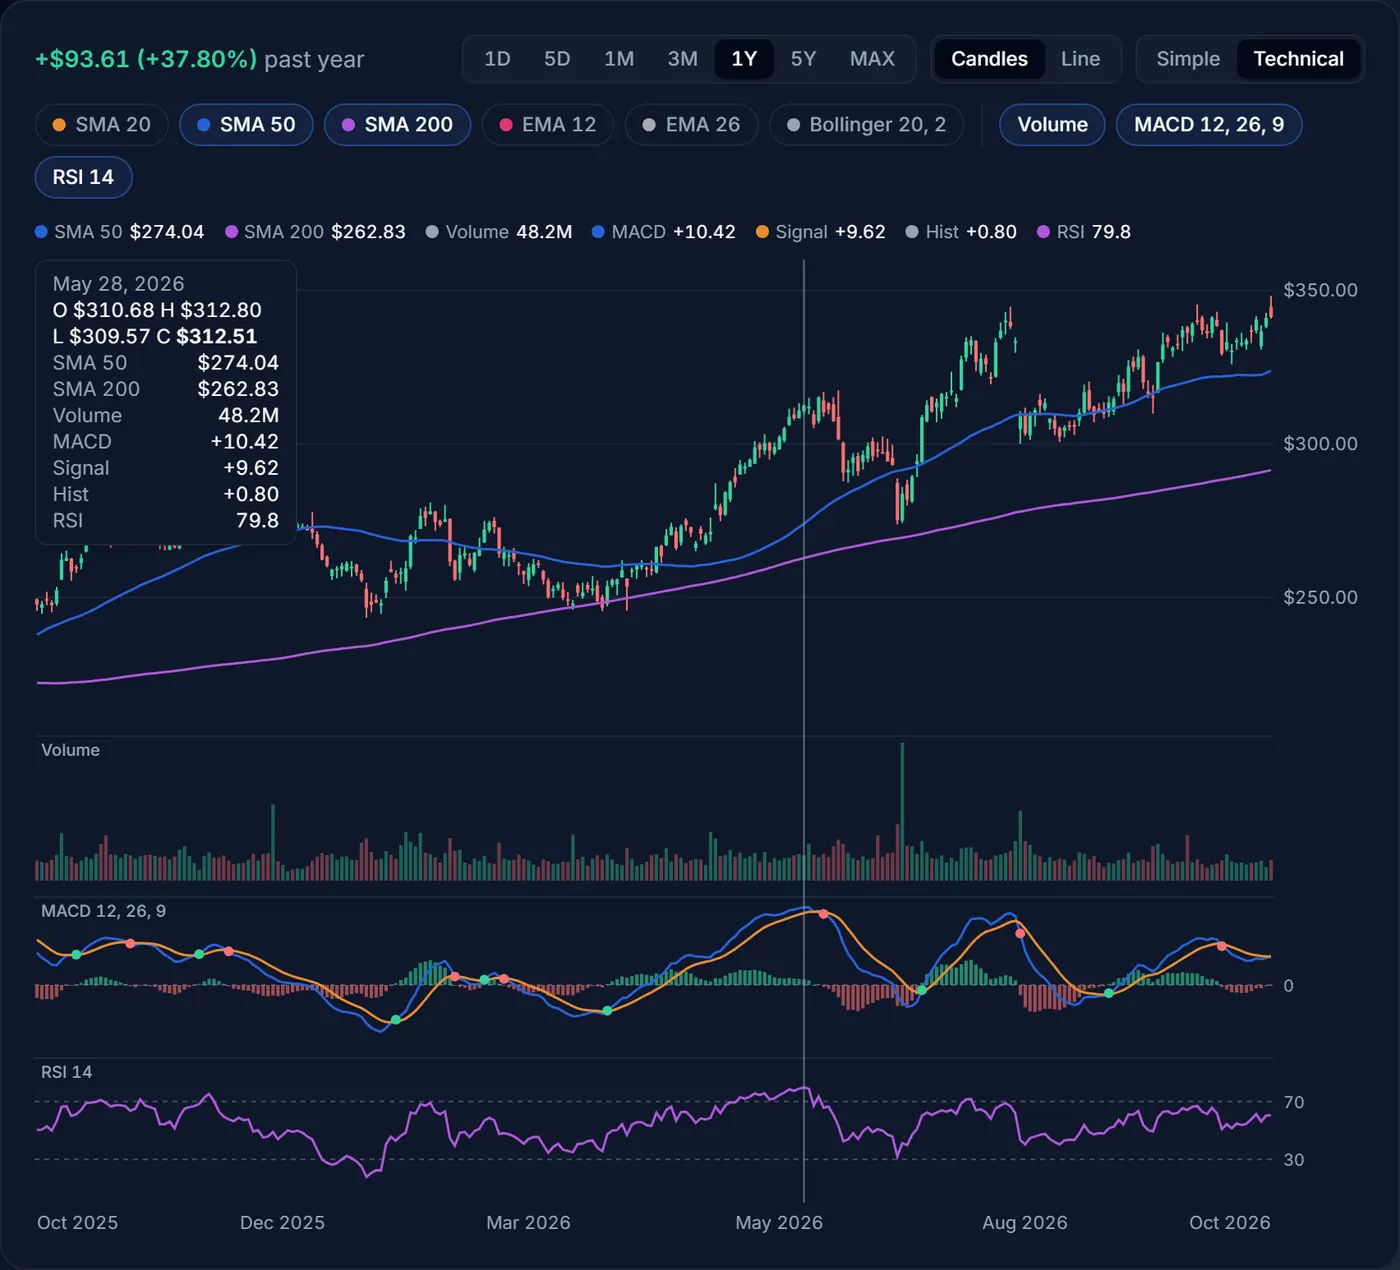
On May 28, 2026, Apple opened at $310.68 and closed at $312.51, so the candle is green. The close was well above both the 50-day ($274.04) and the 200-day ($262.83) averages, and the 50-day was above the 200-day: an uptrend on both horizons.
MACD (+10.42) was above its signal line (+9.62), so the histogram was a small positive +0.80, and RSI was 79.8, overbought. Together: a strong trend whose momentum was positive but no longer growing much. Days later MACD crossed below its signal line (the red dot) and the price pulled back through June. None of these numbers predicted that; they described a fast move that had already happened.
Intraday charts: VWAP and session shading
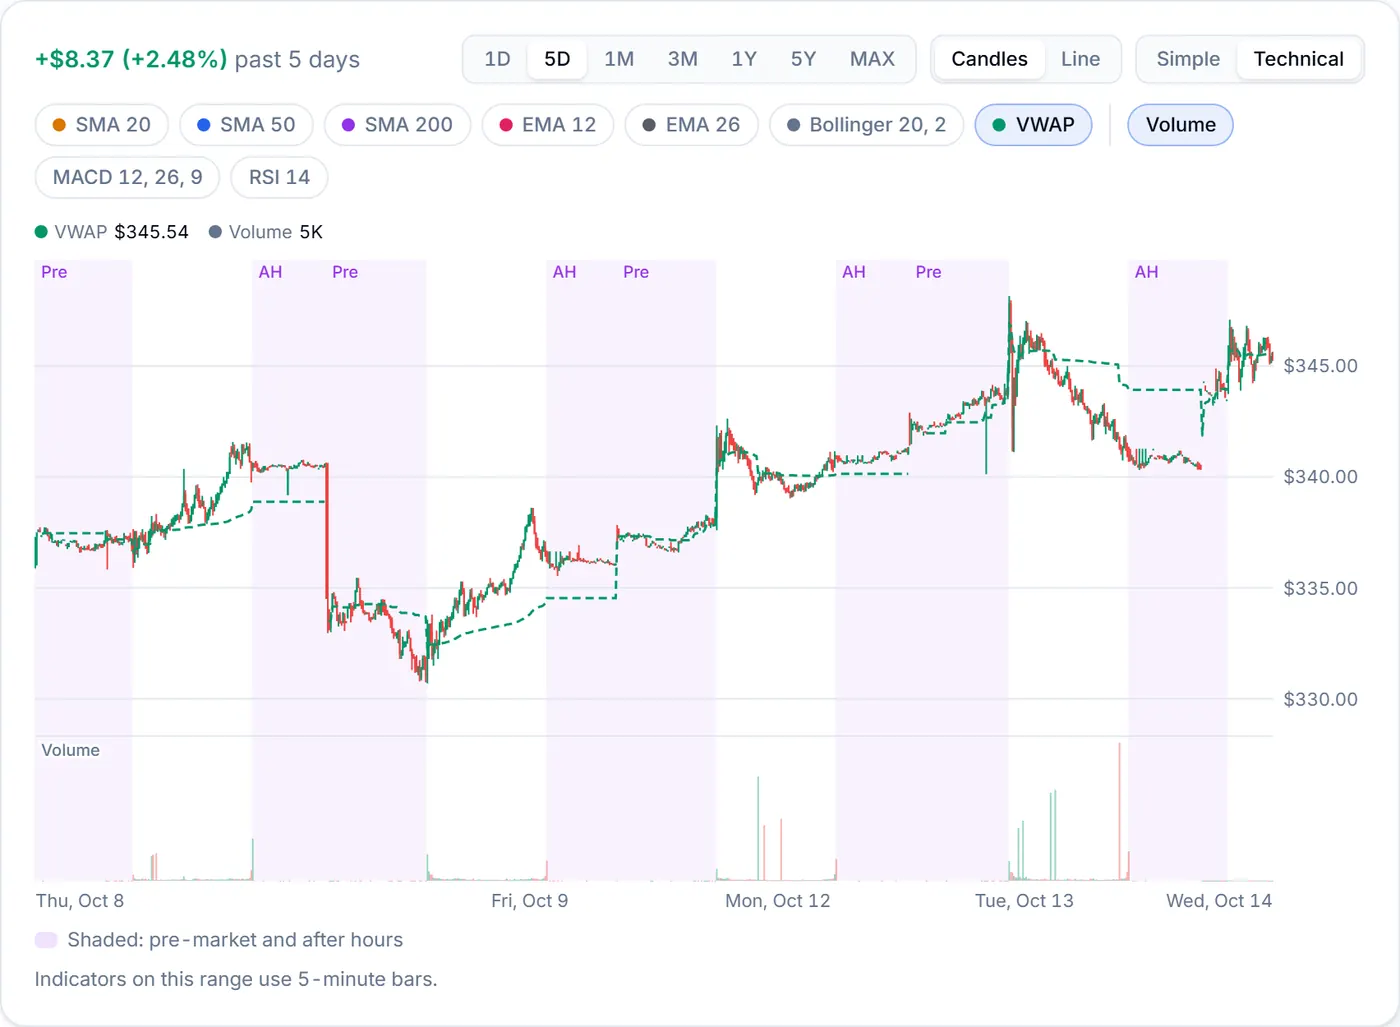
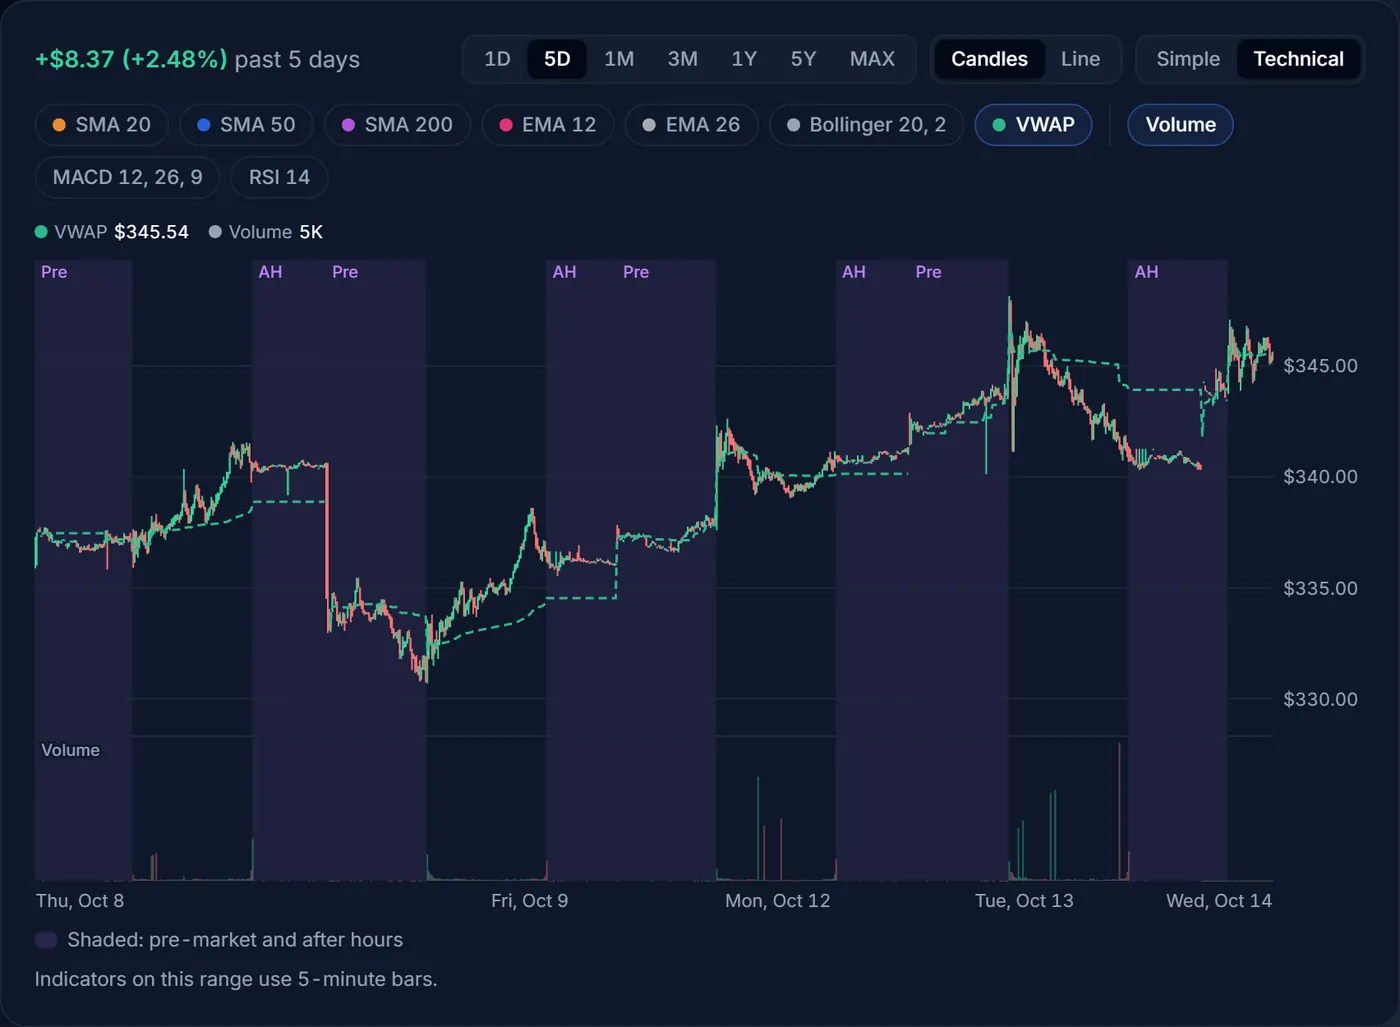
On 1D and 5D each bar is five minutes, and the indicators use those bars, so SMA 50 there means the last 50 five-minute bars, not 50 days. These ranges add VWAP, the volume-weighted average price: the average price paid for every share traded so far that day, with busier minutes counting more. It restarts each day. Traders use it as the day’s fair-price line: above it, buyers have paid up; below it, sellers are in control.
Trading before the regular session opens (pre-market, before 9:30 a.m. ET on a normal day) and after it closes (after hours, from 4 p.m. ET) is shaded and labelled “Pre” and “After hours” (“AH” when the band is narrow). Fewer shares change hands in those sessions, so prices can jump around and gaps between the bid and ask are wider.
Notes the chart may show
- “Some indicators start partway into this range”: an indicator needs earlier bars to start (200 for SMA 200), and this stock doesn’t have enough, often because it listed recently, so its line begins partway across.
- Stock splits: indicators treat a split’s price gap as a split, as the screener does, and a note says so. Prices stay as traded.
- MAX: the longest range skips some trading days, so indicators are switched off there. Choose 5Y or shorter to see them.
The same numbers as the screener
The chart and the screener’s Technicals columns use the same maths, so a stock’s latest RSI, MACD, moving averages and Bollinger readings match its screener row. Screen for candidates, then open each chart for the context. Each preset opens the Technicals columns:
- Oversold large caps: RSI 30 or below and a market value of at least $10 billion, lowest RSI first.
- MACD bullish crossover: MACD crossed above its signal line in the last 3 trading days.
- Golden cross: the 50-day average rose above the 200-day in the last 10 trading days.
- Bollinger squeeze: bands among their narrowest of the last 120 trading days.
- Unusual volume: at least twice the usual volume.
The screener’s “?” buttons explain each filter and column, and link back here.
Practical tips
- Start with the trend. Look at the 200-day average and a longer range before a short-term signal. A bullish MACD cross inside a long downtrend is a much weaker sign than one inside an uptrend.
- Remember that indicators lag. Every line here is worked out from past prices. They describe what has happened, quickly and clearly, but they can’t see news coming.
- Watch for earnings gaps. A report can move a stock further overnight than a month of normal trading, jumping straight past any line on the chart. Check the next earnings date on the ticker page before you act on a pattern.
- Use fewer lines. Two or three indicators you understand beat seven you don’t.
- Look for agreement. A move backed by heavy volume, a MACD cross and a price above its averages tells a more consistent story than any one of them alone, and it can still be wrong.
Risk
Patterns are not predictions
Technical indicators are a way to describe price and volume, not a forecast. Signals fail often, and acting on every cross or RSI reading can mean losing money on costs and bad timing. Use them alongside what you know about the company, and never with money you can’t afford to lose.
Try it with real numbers
Open Apple’s ticker page, switch the chart to Technical and turn on RSI 14. Then hover over the last time it went above 70 and see what the price did next.