

Investing basics
How to read a stock chart: candlesticks, volume and timeframes
Line charts, candlesticks, volume bars and timeframes: what a price chart shows, how to read one bar at a time, and the common ways a chart can mislead you.
Wenlo EditorialHow we write our guides8 min read
On this page
What a price chart shows
A stock chart is a picture of trades over time. Time runs left to right along the bottom, and price runs up the side. Each point or bar summarizes the trades in one slice of time, such as a day or five minutes. Most charts also have a strip of volume bars underneath, showing how many shares changed hands in each slice.
A chart can’t tell you what a company is worth or what the price will do next. What it does well is answer questions a quote can’t: has the price been rising or falling, how much does it usually move in a day, and was today’s move ordinary or unusual? This guide covers the basics that apply to almost any chart. For the indicator lines, such as moving averages and RSI, see How to read Wenlo’s technical chart.
The examples below use made-up prices that don’t describe any real company.
Line charts, bar charts and candlesticks
The same trades can be drawn three common ways:
- Line chart: one point per slice of time, usually the closing price, joined into a line. It is the cleanest way to see the overall direction. An area chart is a line chart with the space underneath shaded.
- Bar chart (OHLC): a vertical line for each slice, from its lowest to its highest price, with a small tick on the left for the opening price and one on the right for the closing price. OHLC stands for open, high, low, close.
- Candlestick chart: the same four prices drawn as a thick body between the open and the close, with thin wicks (also called shadows) reaching up to the high and down to the low.
Candlesticks are popular because the body makes the open-to-close move easy to see at a glance. The color tells you its direction. On most charts, including Wenlo’s, a green (or hollow) candle closed at or above its open and a red (or filled) candle closed below it. Some platforms color candles by the change from the previous close instead, so a candle can be green on one site and red on another. When in doubt, check the chart’s legend or settings.
Reading one candle
Example
One day’s candle
Suppose a stock closed yesterday at $50.50. Today it opened at $50.00, traded as low as $49.10 and as high as $52.40, and closed at $51.80.
- Body: from $50.00 up to $51.80, a gain of $1.80 from the open, so the candle is green.
- Upper wick: from $51.80 up to $52.40, or $0.60. Buyers pushed the price higher during the day, but it slipped back before the close.
- Lower wick: from $49.10 up to $50.00, or $0.90. Sellers pushed it lower early, then buyers took over.
- Day’s range: $52.40 − $49.10 = $3.30.
- Change for the day: $51.80 − $50.50 = +$1.30, or +2.57% from the previous close.
Notice that the candle’s color and the day’s change are measured from different starting points. This one opened below yesterday’s close, so the body measures $1.80 from the open while the quote shows +$1.30 from the previous close. A stock can even close lower than the day before and still draw a green candle, if it opened lower still.
The shape of a candle hints at how the session went. A long body with short wicks means the price moved steadily one way. A small body with long wicks on both sides means the price swung around and ended near where it started. These are descriptions of what happened, not forecasts; a single candle says very little on its own.
Timeframes: range and interval
Two settings decide what a chart shows, and they are easy to mix up:
- The range is how much history is on screen: one day, five days, one month, one year, five years and so on.
- The interval (or bar size) is how much time each candle or point covers: one minute, five minutes, one day, one week.
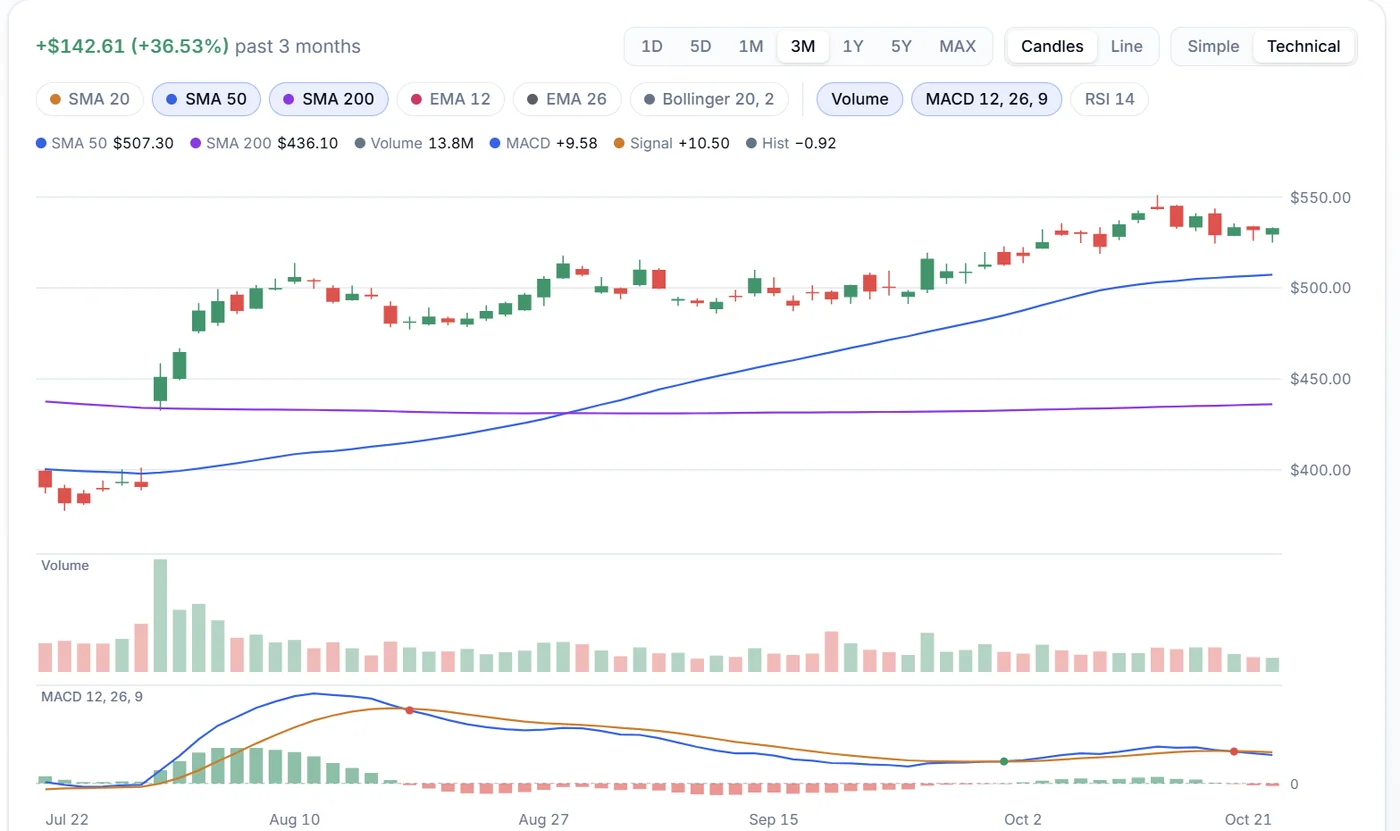
Charting tools usually pair them sensibly for you. On a Wenlo ticker page, the 1D and 5D ranges use five-minute bars, and 1M through 5Y use one bar per trading day. A one-day chart of five-minute bars shows the shape of a single session; a five-year chart of daily bars shows the long-term trend, and a big day barely registers.
The change shown for a range depends on its starting point. On Wenlo, the 1D change is measured from the previous close, and longer ranges from the first bar on the chart. The same stock can be up for the year, down for the month and up today, and all three can be true at once. Before drawing any conclusion, check which range you’re looking at.
Intraday charts may also include trades from pre-market and after-hours sessions, when fewer people trade. Wenlo shades those bars so you can tell them apart from the regular session. Pre-market and after-hours trading explains why those prices can be jumpy.
Volume: how many shares traded
Each volume bar shows how many shares traded during that candle’s time slice. On its own, the number isn’t very meaningful, because a large company might trade tens of millions of shares on an ordinary day and a small one a few hundred thousand. What matters is how today compares with that stock’s usual level.
Example
Comparing volume with the average
Suppose a stock usually trades about 2 million shares a day. Today, by the close, 6 million shares have traded. That is 6 million ÷ 2 million = 3 times its average volume, often called a relative volume of 3.
Heavy volume usually means many people are reacting to something: an earnings report, a product announcement, an analyst’s change of view, or a move in the whole market. A big price move on heavy volume reflects a lot of trading; the same move on light volume involved fewer shares and can reverse more easily. Light volume is also normal around holidays and in the extended sessions.
Remember that volume builds through the day. At 11 a.m., today’s volume will look low next to a full day’s average. The Unusual volume screen on the screener lists stocks trading at least twice their usual volume.
Gaps, trends and price levels
A few features show up on almost every chart:
- Gaps: when a stock opens well above or below the previous close, there is an empty space between two candles. Gaps often follow news released while the market was closed, such as earnings.
- Trends: a series of higher highs and higher lows is an uptrend; lower highs and lower lows is a downtrend. Many charts that look dramatic on a short range turn out to be small wiggles on a longer one.
- Price levels: people often notice prices where a stock has turned around before, sometimes called support (a floor) and resistance (a ceiling). They are areas on a chart that traders watch, not rules the price must obey.
Risk
Gaps skip right past price levels
If a stock closes at $50 and bad news comes out overnight, it might open at $42 without ever trading in between. Any price level drawn at $46 or $48 is simply skipped. That matters if you planned to sell at one of those levels; see Market, limit and stop orders for how different orders behave in a gap.
How charts can mislead
Charts are honest about what traded, but the way they are drawn can change how a move feels:
- The vertical scale. Most charts zoom the price axis to fit the range on screen, so a 2% wiggle can fill the whole chart and look like a cliff. Check the numbers on the axis.
- Linear versus logarithmic scale. On a linear scale, every dollar takes the same height. On a logarithmic (log) scale, every percentage change does: a move from $10 to $20 and one from $50 to $100 look the same, because each is a doubling. Over long periods, a log scale gives a fairer picture of growth.
- Percentages aren’t symmetric. A stock that rises from $40 to $60 is up 50%. If it falls back from $60 to $40, it is down 33.3%, even though it is back where it started.
- Stock splits. In a 2-for-1 split, each share becomes two, and the price halves. Many charts adjust older prices so the split doesn’t look like a crash; others show prices as traded and add a note. A one-day drop of half or more with no news is often a split.
- Hindsight. Patterns look obvious after the fact. On the right-hand edge of a chart, where decisions actually happen, the same patterns are far less clear.
Key takeaways
- Check the range and interval first. Know how much history you’re seeing and what each bar covers.
- Read a candle as four prices. The body is open to close, the wicks reach the high and the low, and the color follows the open-to-close move on most charts.
- Compare volume with its average. Unusual volume is a sign that something happened and is worth looking up.
- Look at the axis before the shape. Zoomed scales and linear axes can make moves look bigger or smaller than they are.
- Treat patterns as context, not signals. A chart describes what already happened; pair it with the company’s news and results.
Charts are a quick way to see a stock’s recent history and to notice when something has changed. They work best as one input alongside the company’s fundamentals and news, not as a reason to trade on their own.
Try it with real numbers
Open a ticker page and switch between the 1D, 1M and 5Y ranges. Watch how the same stock’s story changes with the timeframe, then switch to Technical to see candles and volume together.