

Investing basics
P/E, EPS and valuation: what “expensive” really means
Trailing and forward P/E, diluted and adjusted EPS, the PEG ratio and other yardsticks: how investors judge whether a stock is expensive, and where each measure falls short.
Wenlo EditorialHow we write our guides7 min read
On this page
A high price doesn’t make a stock expensive
A $500 share isn’t necessarily more expensive than a $20 one. The share price on its own only tells you what one slice of the company costs, and companies cut themselves into very different numbers of slices. To judge whether a stock is cheap or expensive, investors compare the price with something the business produces, most often its profit.
That comparison is called valuation. The most common yardstick is the price-to-earnings ratio (P/E): the share price divided by earnings per share (EPS). If you’re new to both, P/E ratio and dividends, explained covers the basics. This guide goes a step further: which EPS goes into the ratio, how growth changes the picture, and what to use when P/E stops working.
All the companies and numbers below are hypothetical.
Which EPS? Basic, diluted and adjusted
EPS sounds like one number, but you’ll see several versions of it:
- Basic EPS divides net income by the average number of shares outstanding.
- Diluted EPS adds the shares that could be created from stock options, restricted stock and convertible securities. It is never higher than basic EPS, and it is the figure most often quoted.
- GAAP EPS follows US accounting rules (generally accepted accounting principles) and is the number in a company’s official reports.
- Adjusted EPS (also called non-GAAP, or “operating” earnings) leaves out items the company considers unusual, such as restructuring costs, legal settlements or the cost of stock-based pay.
Example
Basic and diluted EPS
A company earned $500 million last year and has 250 million shares outstanding. Basic EPS is $500 million ÷ 250 million = $2.00. Employees also hold options and stock awards that could add 10 million shares, so diluted EPS is $500 million ÷ 260 million = $1.92.
At a share price of $40, the P/E is 20.0 on basic EPS and 20.8 on diluted EPS. Small differences like this explain why two websites can show slightly different P/Es for the same stock.
Adjusted figures can be useful when a one-off event distorts a year, but companies choose what to adjust. If the same “unusual” cost shows up every year, it is a normal cost of doing business. Companies that report adjusted numbers must also show how they reconcile to GAAP, usually in the earnings release, so you can see exactly what was left out.
Trailing and forward P/E
A trailing P/E (often labeled TTM, for trailing twelve months) uses the EPS the company actually reported over its last four quarters. A forward P/E uses analysts’ average estimate for the next twelve months or the next fiscal year.
| Trailing P/E | Forward P/E | |
|---|---|---|
| Earnings used | Reported, last twelve months | Estimated, next twelve months or fiscal year |
| Strength | Based on real results | Looks ahead, which is what prices tend to do |
| Weakness | Backward-looking; distorted by one-off years | Only an estimate; analysts can be wrong or slow to update |
| Changes when | A new quarter is reported, or the price moves | Estimates are revised, or the price moves |
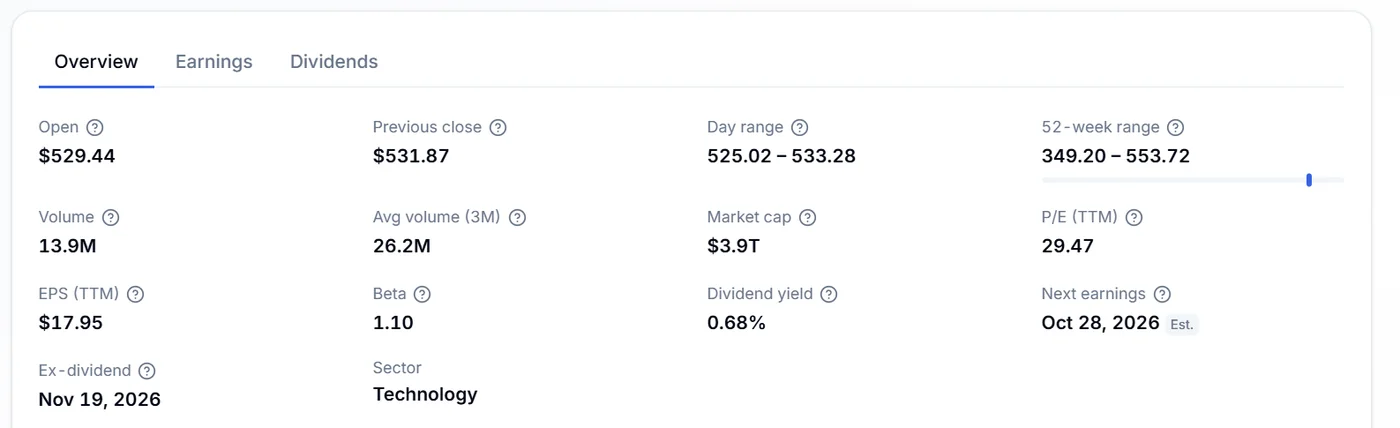
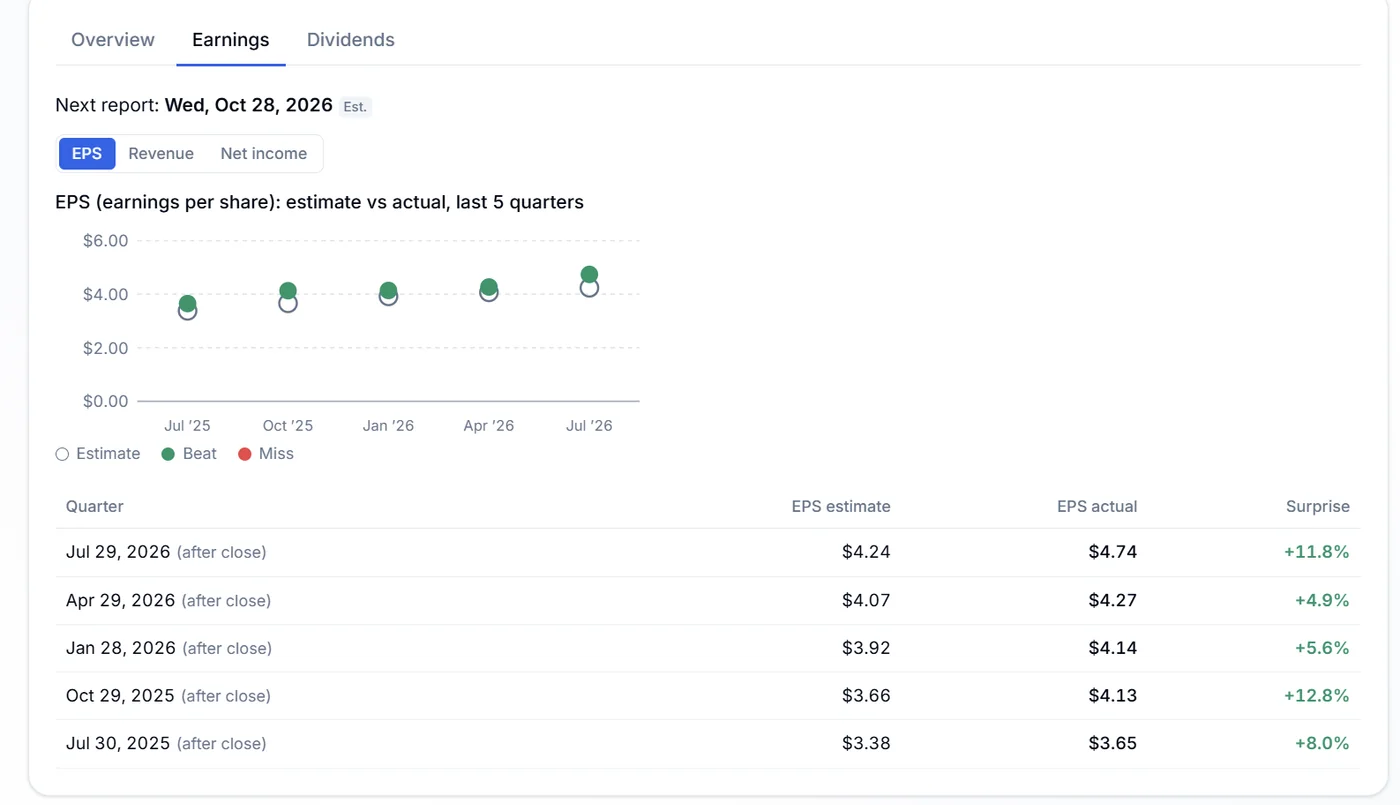
When the forward P/E is much lower than the trailing one, analysts expect earnings to grow. When it is higher, they expect earnings to fall. Neither is a promise. Estimates are often revised as the year goes on, and a company that misses them can see its stock fall even if it stays profitable. On a Wenlo ticker page, the key stats show the trailing P/E and EPS (TTM), and the Earnings tab compares recent quarters’ estimates with what the company actually reported.
Growth changes the picture: the PEG ratio
A higher P/E is easier to justify when earnings are growing fast, because each future year’s profit is expected to be larger than today’s. The PEG ratio tries to account for that by dividing the P/E by the expected yearly growth rate of earnings, written as a whole number (15% growth is 15).
Formula
PEG ratio
PEG = P/E ÷ expected yearly EPS growth (in percent)
Example
Two companies, two growth rates
- Company A: $80 share, EPS of $4.00, so a P/E of 20. Analysts expect earnings to grow about 20% a year. PEG = 20 ÷ 20 = 1.0.
- Company B: $45 share, EPS of $3.00, so a P/E of 15. Analysts expect about 5% growth a year. PEG = 15 ÷ 5 = 3.0.
On P/E alone, B looks cheaper. Adjusted for expected growth, A looks cheaper. A traditional rule of thumb treats a PEG around 1 as reasonable, but that is a convention, not a law.
PEG has its own weak spot: the growth rate is a forecast, often for only a few years ahead. Small changes in that guess swing the ratio a lot, and very fast growth rarely lasts as long as hoped. Different sources also use different growth periods, so PEGs from two sites may not match.
Where P/E breaks down
P/E is quick and widely available, which is why it is everywhere. But it misses a lot:
- No profit, no P/E. A company that lost money has a negative EPS, and most sites show the P/E as blank. Young, fast-growing companies often fall into this group.
- Debt doesn’t show up. Two companies with the same P/E can carry very different amounts of debt. The one with more debt has more claims ahead of shareholders and more risk if business slows.
- Cyclical earnings. Companies whose profits rise and fall with the economy, such as carmakers or chemical producers, often show a low P/E near the peak of a cycle, just before earnings fall, and a high P/E near the bottom.
- Accounting choices. Earnings depend on judgments about depreciation, write-downs and when revenue is counted. Cash flow is harder to shape, which is why many investors check it alongside earnings.
Other yardsticks investors use
Because no single ratio tells the whole story, analysts use several, each suited to different kinds of companies:
- Price-to-sales (P/S): market value divided by yearly revenue. It works for companies that aren’t profitable yet, but revenue isn’t profit, and a company can sell a lot and still lose money.
- Price-to-book (P/B): market value divided by the accounting value of the company’s assets minus its liabilities. It is most often used for banks and insurers, whose assets are mostly financial.
- EV/EBITDA: enterprise value divided by earnings before interest, taxes, depreciation and amortization. Enterprise value adds debt and subtracts cash, so it compares companies with different amounts of borrowing more fairly.
- Free cash flow yield: the cash left after running and investing in the business, divided by market value. It shows how much cash the business throws off for each dollar you pay.
Example
Enterprise value
A company’s shares are worth $10 billion in total. It owes $4 billion and holds $1 billion in cash. Its enterprise value is $10 billion + $4 billion − $1 billion = $13 billion: roughly what it would cost to buy the whole business, debts included, and keep its cash.
Compare like with like
A P/E becomes meaningful when you compare it with something sensible. Three comparisons tend to be more useful than any absolute number:
- The same sector. Software companies, utilities, banks and retailers grow at different rates and carry different risks, so they usually trade at different P/Es. Compare a bank with other banks.
- The company’s own history. A stock trading well above or below its usual P/E range raises the question of what has changed.
- The broad market. The overall market’s P/E moves with interest rates and the economy, so a stock’s P/E is easier to read next to the market’s at the same time.
The screener shows each stock’s P/E with its sector, and you can filter by sector and sort by P/E to see a group side by side. A low number is a reason to ask why, not proof of a bargain: the market may be expecting earnings to shrink.
Key takeaways
- “Expensive” means a high price relative to what the business earns or is expected to earn, not a high share price.
- Check which EPS a P/E uses: diluted or basic, GAAP or adjusted, trailing or forward.
- Growth can justify a higher P/E. PEG adjusts for it, but relies on a forecast.
- P/E ignores debt and cash flow and breaks down for unprofitable or cyclical companies, so look at other measures too.
- Compare within a sector and against the company’s own history.
Valuation ratios are a way to frame questions about a company, not a verdict on whether to buy it. The company’s own reports, and how its business is changing, matter more than any single number.
Try it with real numbers
Open a ticker page and compare its P/E and EPS with the Earnings tab’s history. Then use the screener to filter one sector and sort it by P/E.